Pages

Friday, May 24, 2024

Day 16: Parks with the President


Hello everyone! This is Hayes and Sam, and we will be your guides to today’s adventures! Today we were in the Magic Kingdom and Hollywood Studios, with a midday break for lunch and class. We can’t wait to tell you all about it!

We started the day in the Magic Kingdom. For the past few days, we have been collecting data throughout the parks, and today was no exception. Hayes’s group is studying party size distributions, so he was stationed at Big Thunder Mountain Railroad to count party sizes as they entered the ride. He, Jack, and Tyler got permission from a manager to stand near the exit and collect data, but had to leave once the ride got busy. With their vantage point taken away, they resorted to going through the line and counting party sizes as they got onto the ride. After a few hours of riding, they had enough data to help the project. Sam’s group is collecting data on Tower of Terror, which is in Hollywood Studios, so they helped other groups collect data in the Magic Kingdom. Sam helped the group studying omni-mover rides collect information regarding wait times at Buzz Lightyear’s Space Ranger Spin. She went through the ride with Alyssa and counted their wait time to compare it with the posted wait time. We have been comparing our actual wait times to the posted wait times throughout the trip, but one group will be taking a special look at how well these statistics match up for rides that are on a conveyor belt. We are excited to see their findings! Sam and Alyssa continued collecting data about the rides' wait time for the rest of the morning in Magic Kingdom.

We returned to the hotel for lunch before the weather got too hot. It is summer in Florida; standing in the sun is not fun when it is over 90 degrees. We were very glad to spend the worst of the weather indoors. We were given about an hour to rest, eat, and prepare for class. Hayes spent the time playing Sabacc with Will, Erin, Hannah, and Riley. Sabacc is a Star Wars card game sold at Disney. This is the same game that Han Solo won to get the Millennium Falcon! Our stakes weren’t quite so high, but we had a good time pretending we were playing cards at Mos Eisley. Sam spent the break resting, getting caught up on laundry, and making lunch.


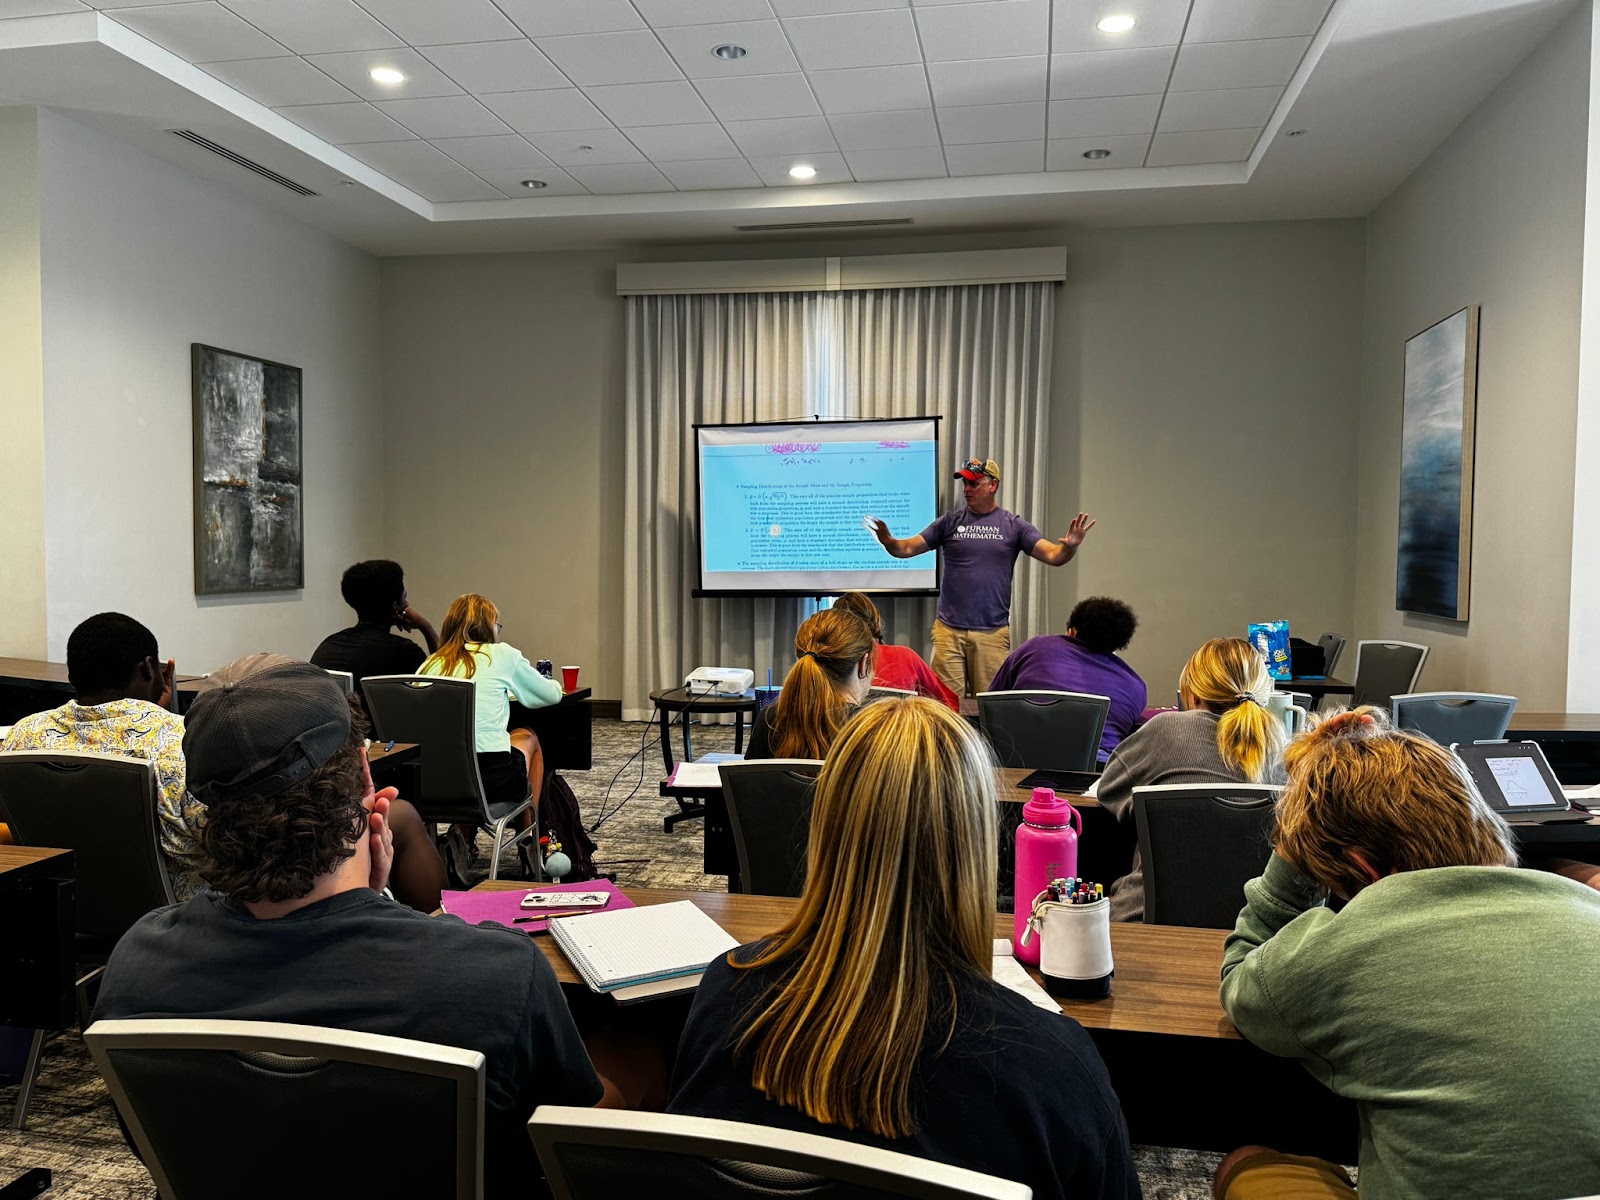
In class today, we learned about statistical distributions. This will be immensely helpful in our research problems. We are researching how our observed data varies from what we expect, and the methods we learned today will tell us whether the differences we observe are likely due to random chance or if there is another force at play. These statistical tests will give us the power to draw conclusions from the data we are collecting!


We also were given a new project, the 4-Park Challenge. For the tenth anniversary of Math and the Mouse, alumni were invited back to participate in a special competition! We will race to ride as many rides as we can, similar to the Traveling Tourist Problem that we competed in earlier in the trip. However, this is an expanded competition. We will be able to go to any park, ride any ride, and view any show for differing point values. These values were derived from the rides average wait time, length, and average down time. Alumni will be competing on their own teams, as well as President and Dr. Davis! The Davis’ will be on the professors’ team. Maybe President Davis will bring the professors luck in this competition. After losing the Traveling Tourist Problem for the fifth time in a row, the professors are looking for redemption. We will be doing our best to make sure that doesn’t happen! We spent the next hour plotting our strategies. We would tell our strategies, but we don’t want to steal tomorrow’s blog’s thunder! Tune in tomorrow to see how we do!

After our planning was done, we headed to Hollywood Studios to collect more data, especially for a project concerning Toy Story Mania. While most projects require counting people for long periods of time, this project involves scoring points and playing games. Sometimes data collection can be fun! We also went on some other rides to collect wait times, party sizes, and other statistics. Meanwhile, Sam’s group watched the ride pictures at the bottom of Tower of Terror to count the empty seats on each ride. They plan on using this data, as well as data they have collected regarding party sizes, to develop an algorithm for seating people on the ride. They hope to make an optimal algorithm to seat people more efficiently than Disney.

We finished the day by riding the Tower of Terror with President Davis! We made sure to pose for the picture with our distinguished guest. It was so fun we rode it a second time! We are so glad we got to share our Disney experience with the Davis's today, and we are so glad we got to share it with you through this blog! 

Peace out!

Hayes Brown and Sam Pearson


Wednesday, May 22, 2024

Day 15: We are Clearly FANs of Math and the Mouse!

Hello again everyone! This is Jacob and Erin taking over for another action-packed and exciting day! This may be one of our all-time favorite days here at Math and the Mouse, as we had a productive morning, a learning-intensive afternoon, and an awesome event in the afternoon - keep reading for all the details! 

We started bright and early by heading to EPCOT to collect data for our third research project. The four groups in our class split up to find data for each respective project. Other groups went to Remy's Ratatouille Adventure, Test Track, Finding Nemo, Soarin', and Frozen Ever After to collect data for their projects. The two of us, along with Morgan and Hannah, went to Spaceship Earth to research whether the difference between posted wait times and actual wait times were consistent on omnimover rides compared to other types of rides. For context, an omnimover ride is a ride where the entire collection of cars are consistently moving on a singular track, and riders often need to get on and off while the ride is still moving. Other examples of this type of ride include Haunted Mansion and Buzz Lightyear Space Ranger Spin.

We spaced each other out in five minute intervals and rode, making sure to document the times we waited for, as we would use ourselves as our points of interest. We got on. Then, we got on again. Then, we got on again. Then… 

Okay, we won’t repeat the same joke we made a few days ago, but we rode it so many times that we definitely became exhausted from sitting through a fourteen minute ride multiple times. We decided to spice it up by choosing different language options to listen to for the ride. (Shoutout to Portuguese for being the fan favorite between all of us!) In reality, we appreciate that Disney is inclusive and able to accommodate many languages for non-native English speakers on the ride. We also had a round of support from Savannah, John, and Tori, who all volunteered to ride. After getting in the points we needed, we made our way back.


After a short break for showers, lunch, and a few naps, we headed back to the classroom to talk more about binomial distribution, probability, and geometric distribution. To refresh from class a few days ago, Dr. Hutson talked through the formulas and explanations behind binomial distribution and explored some algebraic techniques to further understand why this formula makes sense logically. We looked at a few visual and algebraic formats that really allowed all of us, regardless of how many math classes we have taken, to fully understand the content we were discussing. It is extremely fascinating to see how many different courses can be touched on in this condensed three week period, and today was no exception to this! We also discussed and explored the idea of expected value, both with a mathematical approach and a game based one. First, we started by discussing the definition of an expected value, which has to do with weighting the value of each outcome with the probability of it showing up. We related this back again with the binomial distribution formula and after some fun algebra, we landed on a formula that was exactly what we expected (get it? Joke credit to Dr. Hutson): the value times the probability. After that, we related it to one dice role and after reviewing some techniques from calculus, we were able to understand this idea with an example. 


After finishing up the lecture, we tested out these ideas in a game format with many different rounds based on the game High Score. This had us roll five dice and try to get the highest score with different rules which started with just having three rolls and having to roll all five at a time, then being able to choose which die to roll for each round, seeing other rolls at the table, and requiring pairs of dice to win. Each of these rules had a different challenge to it, and both of us did quite well. It was interesting to regroup afterwards and see all of the mathematical connections from this game to what we were learning about. 


From there, the group that was presenting at the FAN event (see below) practiced one final time, then all of us got ready quickly to head to downtown Orlando! We were invited to attend and present at the Furman Alumni Network event to launch Clearly Furman, which we had a blast at as we shared our experiences and value in Math and the Mouse and celebrated all of the aspects of the Furman Advantage. We first got a tour of the INTER&Co Stadium in which we saw the press room and had some fun behind the microphone, explored the locker rooms, and got to walk through the tunnel that the soccer players walk through! From there, we had some time to network and snack before the programming for the event started. Len Testa, the president of touring plans who we met with last week, started the presentation by talking about what he does and got the audience equipped with understanding how optimization of Disney World works and what he does for a living. From there, we heard from President Elizabeth Davis about all of the good that the Clearly Furman, a campaign for our third century, is doing and plans on doing for the Furman Advantage and Furman as a whole. It was so refreshing to hear about all of the amazing things that our university is doing. We are feeling very proud of our university tonight! 

After her speech, our three professors as well as 6 students: Savannah, Virginia, Will, Sam, Alyssa, and John, presented on Math and the Mouse and absolutely killed it. In the audience, we were all rooting really hard for all 9 of them as they shared our experience and projects we have been working on for the last two weeks. Their presentation was full of great jokes that really got the audience laughing, which was amazing. We are so proud of all of the presenters! After their presentation they accepted some questions, then Ellis finished us off with an amazing speech about what Furman has been for him, which brought near tears to all of our eyes. Following the presentations, we had more time to network with alumni and other members of the Furman community and then left with some name-tag shenanigans. This was such a fun event and we are so thankful that we were able to participate!


After a long day, we all decided that we should go out to a favorite place of ours: Twistee Treat! We went to the location that was supposedly the original spot that started the tradition in the first place. We “attempted” to fit the entire cohort into the large beach chair, which somewhat worked, but the effort and the heart were there, and it was a realization of how close we all have gotten through this experience. We also sang happy birthday to a woman who was celebrating her birthday and her first time in Orlando. Twistee Treat is a tradition that we hope the next cohort gets to experience!


It’s crazy to think that we are nearly two-thirds of the way through this trip. These first two weeks have been memorable, and we cannot wait to wrap up the last week with incredible projects and great memories. After all, it feels like yesterday that we sent our applications for this program. We miss all of you back home, and we hope you all enjoy what this final week will have to offer!


Thanks for reading!

Erin and Jacob


Honorary Mention Photos (too many from today):


Day 14: From Business Analytics to Biergarten Apple Strudel

Hi all!! This is Savannah and Emily taking over the blog for today. From the minivan at 7:45 am to Epcot at 9:30 pm, we were attached at the hip all day long. So to continue this trend, we will be recapping today’s events in tandem. 

To begin the day, we all hopped in the vans and took a 30-minute drive over to an off-campus Disney office in Orlando. Today was particularly exciting because we got to spend the day with Disney professionals talking about some of the things we love most -- math, data, and, of course, Disney! This experience was so special because we got insight to some of the data driven decisions and projects that run behind the scenes every day. From animations to business operations, we got a quick glimpse into the mathematical side of Disney that not many others get to experience. In fact, we even got to see some super top secret projects, but sadly we will not elaborate any further to protect the magic for all reading. Regardless, this was a once in a lifetime experience and we can only thank our professors for this super cool opportunity.


In addition to the Disney professional talks, some of our classmates also got the chance to present our Mickey Bar, Traveling Tourist, and workforce scheduling projects to these same professionals. This showcased all of the hard work that we've accomplished over the past couple weeks here in Walt Disney World.


After a long day in the office, we needed to refuel! To do this, we headed to one of the best buffets that Epcot has to offer -- Biergarten. After a quick nap in the van, we were ready to chow down on bratwurst, schnitzel, and apple strudel. While we enjoyed the delicious food, we watched a polka show of hand bells, alphorns, and other great musical performances. The show got so lively that some of our classmates (Savannah included) went to the dance floor to bust a move amongst the kids. Needless to say, Biergarten was a wonderful experience of good food, great music, and better company to conclude a long, exciting day. 

Just kidding! A day would not be complete at Math and the Mouse without riding a few rides. So, after eating, we went to hop in line for the ever-fun Guardians of the Galaxy ride. For those who don't know, there are six different songs that can be played on this ride. This go-round we listened to the song “Everybody Wants to Rule the World” which made for a great time. After a group of us rode Guardians, we headed over to the Mexico area of the Epcot World Showcase to meet up with the rest of the group and watch the fireworks. We never thought a firework show could invoke so much emotion, but this one proved us wrong. This wasn’t just a firework show, it was a spectacle of water features, lights, songs, and synchronized fireworks to make for an unforgettable experience.


Overall, today was magical in so many ways. From the corporate offices to the firework show, Disney never fails to provide a spectacular experience. I hope everybody enjoyed today’s blog! While we hate to leave, we need some beauty sleep so that we can wake up bright and early to do it all 
again tomorrow! 

Goodnight and don’t forget to tune in tomorrow for the next MatM blog, 


Much love, 

Savannah and Emily <3


Monday, May 20, 2024

Day 13: Disney, Delectables, and Data

Guess who’s back, back again. Ellis and Riley are back, tell a friend.
We started off today by getting feedback on presentations that we will be giving at events on Tuesday and Wednesday (more to come in blog posts ahead).  


After we met to conclude our work for Project 2. This project focused on scheduling shifts at a restaurant. Each shift had a workload requirement, and our goal was to minimise the number of people the restaurant had to hire to cover the workload requirements. There were several groups, each with different approaches to the problem, and that was brilliant to see. After hearing the presentations and getting feedback from the professors, we made preparations to head out to the Magic Kingdom, and we got some ice cream


We have commenced work for our final project; however, in contrast to our previous projects where we were given data to work with, our new projects require us to be in the park collecting the data we need. Fortunately, we have spent a week and a half getting to know Disney World and its rides, so our time in Magic Kingdom today was not about riding rides, but collating data and exploring possible questions for our projects. We are now interacting with the park in a new way, and this is causing us to run into new problems we otherwise never would have. For instance, some groups were only able to stay and collect data for a limited time frame and data collection ran a bit slow.  


Ellis and I are both in the same group, along with Alyssa, Hayes, Katie, and Will, and the information that was most relevant to us was the party size distribution of people going on certain rides. To do this, we selected some rides, Pirates of the Caribbean, It’s a Small World, amongst several others, and we would join the queues and attempt to count out the numbers in which people arrived. There are several setbacks we have faced in our attempts at data collection, but those setbacks are forcing us to be creative and develop workarounds to our limitations. As mentioned earlier, our class has been sectioned into different groups with each working on a different project, but everyone is contributing to every project through data collection. Furthermore, because of the time we’ve spent together working on projects, writing blogs, and exploring Disney World, we’re able to work as a team and collaborate. Data collection can be tedious, but everyone is supportive of one another, and that makes it a tad easier.


That being said, it has been a truly busy day, but fun and fulfilling nonetheless. We’ve only just begun collecting data and answering our questions, so we are super excited to see how everything develops from here as we approach the end. 


Well, till next time.  

Cheers from Riley and Ellis

Day 12: Who’s the Best Liar in Town?

Hey everyone!

Today was unlike any other day at Math and the Mouse. This morning we got to gamble! But, not actually. We were taught the game of Liar’s Dice. The game is played by giving each player a cup and five six-sided dice. Every round players roll and conceal their dice. One player starts and makes a bid reflecting the quantity of a value shown by each die. For example, if there are 6 people playing and the player has values 2, 3, 4, 5, 6, the bidder might bid there are at least 6 fives at the table. The next player has three choices. Challenge, raise the bid, or call “spot on”. 

When challenged, if the bid is correct, the challenger loses a die; if the bid is wrong, the bidder loses a die instead. When raising the bid, the player must choose either a higher quantity or higher value, such as bidding either at least 6 sixes or at least 7 fives. If “spot on” is called, the caller loses a die if there is not exactly what they called; otherwise, the bidder loses a die and the caller receives that die. This process repeats until there is one player left standing. 


Much like our TTP activity, Liar’s Dice sparked some fierce (and loving!) competition among our classmates. As you can see in the pictures below, there was a lot of excitement and dramatic moments. Whether we lost or won, everyone enjoyed bonding and making jokes. Liar’s Dice made for an exceptionally fun morning!


We played Liar’s Dice a number of times until we crowned our winner, or should I say liar?, Will Hutson. Then we were lectured about the relation of the game to binomial distributions. For instance, there are a fixed number of trials (the number of dice), there is a fixed probability of success (⅙ for each value), there are two mutually exclusive outcomes (a chosen value or not), and that the trials are independent. With this information, we can find the probability of a certain bid and determine if we believe the player is lying or not. 


After the lecture and some time to finish up our workforce scheduling projects, we had a meeting about our third and final project! We voted on our favorite topics and were divided into groups. There are four projects each which include different rides and types of data. Over the course of the next eight days we will be collecting data on these rides to help us answer the questions posed below.


The first project asks which factors are most important in getting a good score on the Toy Story Mania ride. Should you shoot or aim with your dominant hand? Should you sit on the left or right of the ride? Does a good partner raise your score or lower it? This project hopes to answer these questions and more by tracking our scores and accuracies over the next week.


Next, our second project wants to determine whether larger groups prefer six-seater rides, such as Test Track, Remy’s Ratatouille Adventure, and Smugglers Run. One theory is that these rides are more popular among families, so the group sizes should be larger for six-seaters than for similar rides.


For the third project, we are curious whether the posted wait times for continuous loading rides is more accurate than other rides. Continuous loading rides never stop, and people step directly on or off the ride as it is moving. Does this constant movement make the wait times more accurate? How do actual wait times compare to Len Testa’s predicted wait times? We shall see.


Finally, our last project is all about the Tower of Terror. The only thing worse than being trapped in a falling elevator is waiting in long lines for a falling elevator, so limiting the number of empty seats on the ride is important. Early estimates suggest half of all elevators have empty seats, which adds up over the course of the day. This group aims to fix that with better strategies for placing people on the ride.


So, we headed into Hollywood Studios for our first round of project three data collections. By splitting up into groups we could focus on data for Toy Story Mania, Smugglers Run, and Tower of Terror, which relate to the first, second, and fourth projects listed above. 


Hey everyone! It’s Hannah again. I thoroughly enjoyed today because I got to do two of my favorite activities, play games and ride rollercoasters! The Liar’s Dice game was so much fun for me because it is a lot like my favorite game, Texas Holdem. I like these games because they involve both probability and skill. Now, back to the rollercoasters! When we went to Hollywood Studios, I was involved in gathering data from the Tower of Terror which included going to the photo section after the ride and counting the number of empty seats in each cart. I was also able to go on the ride twice! After my data collection at the Tower of Terror, our group headed over to Toy Story Mania to collect even more data for a different group’s project. Learning all the Easter eggs on this ride, as well as riding with both Dr. Hutson and Dr. Bouzarth, allowed me to get my all time high score of 204,600!


Jack here! Today was another early morning which included a great game of Liar’s dice. Turns out I am not a very good liar, but maybe that’s a good thing? Regardless, it was a ton of fun and directly led us into our class lecture about probability. Later, we picked out some delicious lunch for tomorrow from a local pita restaurant, which I am definitely looking forward to. Then, once our final project groups were revealed, we had some time to wrap up the workforce scheduling project and begin making progress towards our presentations with Team Disney. My day concluded with some data collection at the Tower of Terror and Toy Story Mania. At the Tower of Terror, it was a lot of fun to hear from the Disney employees what tricks they use to ensure there are no wasted seats. We will certainly be using their insights to craft our own strategies and rules. As for Toy Story Mania, targeting the Easter eggs boosted my score from ~120,000 to over 170,000. I still need practice, but I am consistently improving my score and accuracy.


It’s been fun, but we need to get some sleep soon. We are very excited for tomorrow and looking forward to our presentations to Team Disney on Tuesday. There, two groups will present on our previous projects: Mickey Bar Carts and the Traveling Tourist Problem. These teams have been hard at work refining their presentations, and we can’t wait to see the final products! 


Until next time, 

Jack and Hannah


Sunday, May 19, 2024

The Accidental Tourist

As you may have read in previous blog posts, our class recently participated in an activity called the Traveling Tourist Problem (TTP). This was a Math and the Mouse version of the Amazing Race, of sorts, and we, the professors, would like to take a turn at blog writing and and share some details about this activity.  

One purpose of the activity is to give students the chance to understand the complexities of decision making. The main topic of the course itself is the mathematics of decision making, and this activity gave them first hand experience.

Some decisions lend themselves nicely to a "brute force" approach --- let me consider all possible options and then choose the best one (whatever "best" means to me). Most decisions, however, have too many options to be able to consider all possible choices, and the Traveling Tourist Problem is one of these examples.

Teams of three students each (plus one professor team) were given the task to visit and ride twelve different attractions in the Magic Kingdom --- and to do so as quickly as possible. The twelve attractions were ...

  • Big Thunder Mountain
  • Buzz Lightyear’s Space Ranger Spin
  • Dumbo
  • Haunted Mansion
  • It’s a Small World
  • Jungle Cruise
  • Peter Pan’s Flight
  • Pirates of the Caribbean
  • Many Adventures of Winnie the Pooh
  • Seven Dwarfs Mine Train
  • Space Mountain
  • Under the Sea—Voyage of the Little Mermaid

On the day before the big race, teams were given data regarding expected wait times for each ride (for every 15-minute interval of the day) and the walking times between attractions. Using this information, teams could plan their strategies for the next day. Which ordering of these twelve rides would mean the fastest completion?

If a team thought that they could just check all possible orderings and choose the fastest one based on the data, then they quickly realized such a plan would not work. There are 12! (=12 * 11 * 9 * ... * 3 * 2 * 1) different ways to order the rides. This is almost 480 million variations!

This activity is related to a famous problem in mathematics called the Traveling Salesman Problem. In this problem, a salesman needs to find the shortest route connecting all of his target cities. As the number of cities increases, finding an optimal solution quickly becomes intractable (i.e. very difficult for even the fastest computers). The problem our students worked on is actually harder than this one, since the wait times at each attraction vary throughout the day. So, while it was not realistic for any of us to find (and know we found) the fastest route, it was still fun to do our best and see what we learned.

There are a number of strategies that teams could have implemented. Among them are ...

  • try to minimize walking distance
  • try to minimize total waiting time
  • go to most popular rides first
  • get as many low-wait rides as possible early

Teams could also wait to see what opportunities arise on the day itself. Since there are lots of unexpected things that can happen (especially rides going down for a period), it is sometimes beneficial to be flexible.

The conventional best first move in the Magic Kingdom is to go immediately to Seven Dwarfs Mine Train --- the ride that typically has the longest average waiting time throughout the day. Interestingly, only one of our teams made this move. Other teams made different decisions. One team went first to Peter Pan's Flight (another ride with very long waits), one team went to Space Mountain. One challenge with these rides is that they are in an area of the park that was open 30 minutes earlier than we could enter (open early for guests staying in Disney hotels). So, even when they were the first ones in our group to enter, there were already people in line when they got there. Several other groups headed first to Adventureland and Frontierland, areas of the park that had popular rides AND that were empty immediately prior to the teams' arrival.   

In the image below, you will see all of the first rides that were chosen by the groups --- and the numbers in the circles represent the finishing place of the corresponding team.


This year's first place team (Emily, Savannah, and Virginia) started at Space Mountain, picked up the nearby Buzz Lightyear afterwards, and then went to the popular Seven Dwarfs Mine Train third (waiting only 16 minutes for this popular ride). Interestingly, they waited the exact same amount of time for this ride as the team who went there first. So it seems that the trip to Space Mountain first was a wise one. The winning team did save a few longer rides until the end, waiting 25 and 35 minutes (respectively) for Pirates of the Caribbean and Jungle Cruise. Overall, the average wait time for the first place team over all twelve rides was 12 minutes and 35 seconds. Impressive! You can see their winning path in the figure below with colors following rainbow order showing the passage of time (red shows the first hour of the day, followed by orange, etc.).


The professor team, keeping the non-winning streak alive, finished in fifth place. We waited an average of 13 minutes and 20 seconds in line over the twelve rides. That isn't terribly different from the winning team's average wait, but since that team spent less time walking between rides, they finished 30 minutes before the professors did.

Interestingly, the team who finished in a close second place (Hannah, Tyler, and Will) waited an average of 14 minutes and 15 seconds in line --- nearly two minutes longer per line than the winners. They finished the activity just four minutes after the first place team, and this suggests that they made up their time by walking shorter distances than the first place team. Indeed, the first place team walked around 2.3 miles, and the second place team walked just over 2 miles. By comparison, the fifth place professor team walked over 2.7 miles.

Two days after the activity was complete, our students had the chance to meet Len Testa, president of touringplans.com --- a company that provides efficient plans for visiting attractions in Walt Disney World and in other theme parks. Len enjoyed hearing about the students' adventures, and they, in turn, enjoyed hearing about all of the things that go into the ability to provide personalized plans for tens of thousands of subscribers.

All teams have enjoyed recounting their strategies and stories. It was really rewarding to us as professors to see our students engage in skills that are important in all aspects of life: planning, adapting, executing, and having fun. Through this activity, students saw firsthand the importance of careful decision making, the reality of uncertainty, the benefits of thinking on your feet, and the significance of collaboration and teamwork.

First place team: Emily, Virginia, and Savannah